mod30-residue-lanes / lab report
Notebook 23 — Graph Embeddings of Residue-Lane Manifolds
Rolling lane trajectories become graph geometry:
rolling trajectories → lane similarity graph → Laplacian embedding
Overview
Notebook 23 turns temporal lane relationships into graph geometry.
Notebook 19 tracked temporal spectral phases across rolling residue manifolds. Notebook 23 converts those lane relationships into graph nodes, weighted edges, Laplacian embeddings, graph modes, and graph signal trajectories.
19 → temporal spectral dynamics
23 → graph manifold embeddings
29 → sparse reset-boundary emergence
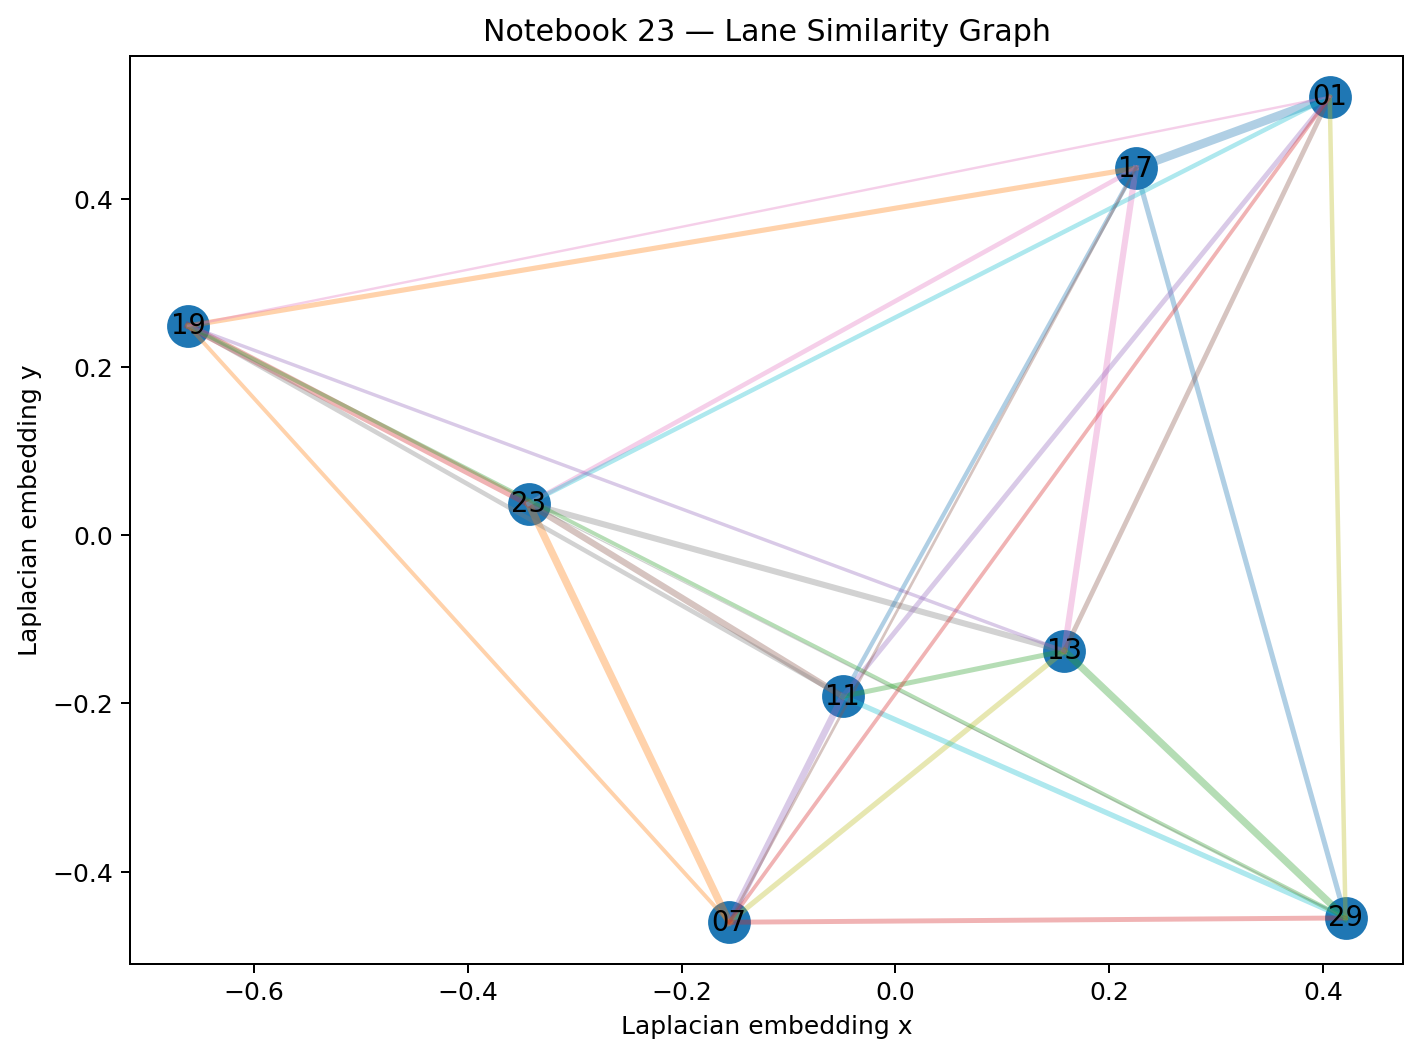
The result is a learned residue-lane network: eight admissible lanes become graph nodes, and their weighted edges emerge from rolling prime-lane trajectory similarity.
Core Features
| Feature | Description |
|---|---|
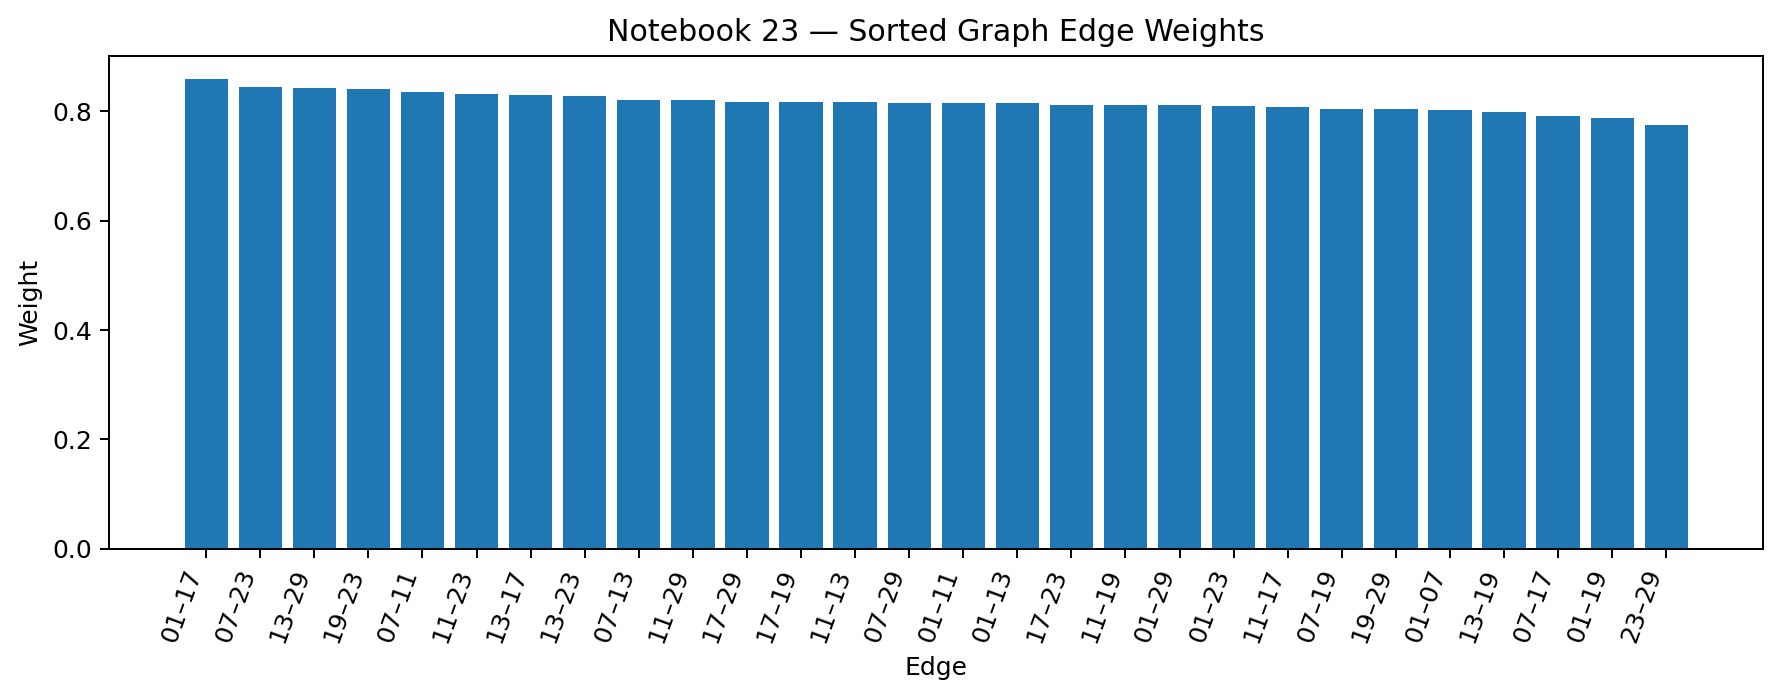
lane_similarity_graph |
Weighted graph where residue lanes are nodes and trajectory similarity defines edges. |
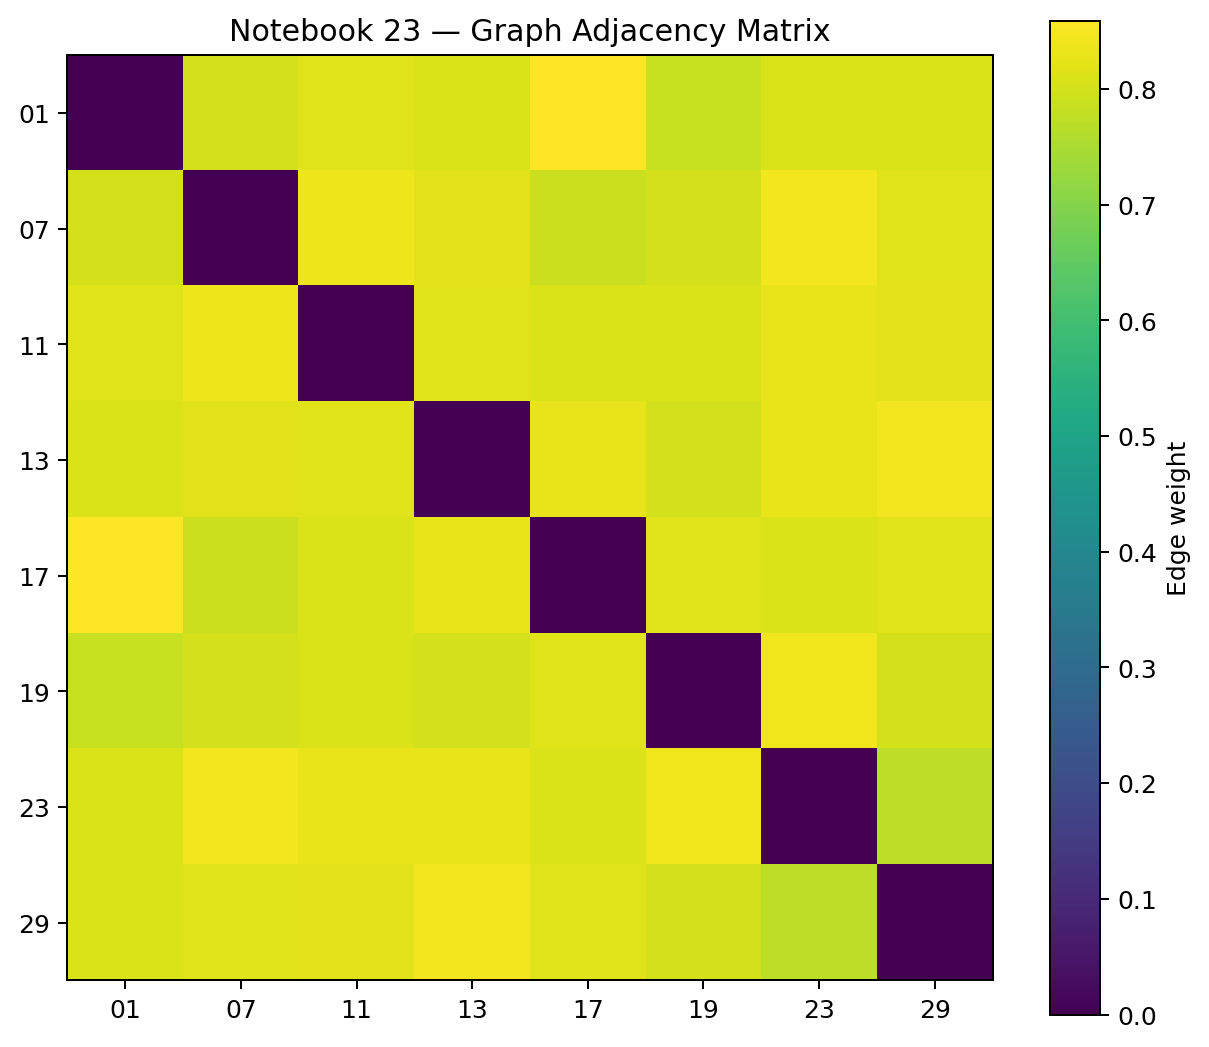
graph_adjacency_matrix |
Matrix of weighted relationships between residue lanes. |
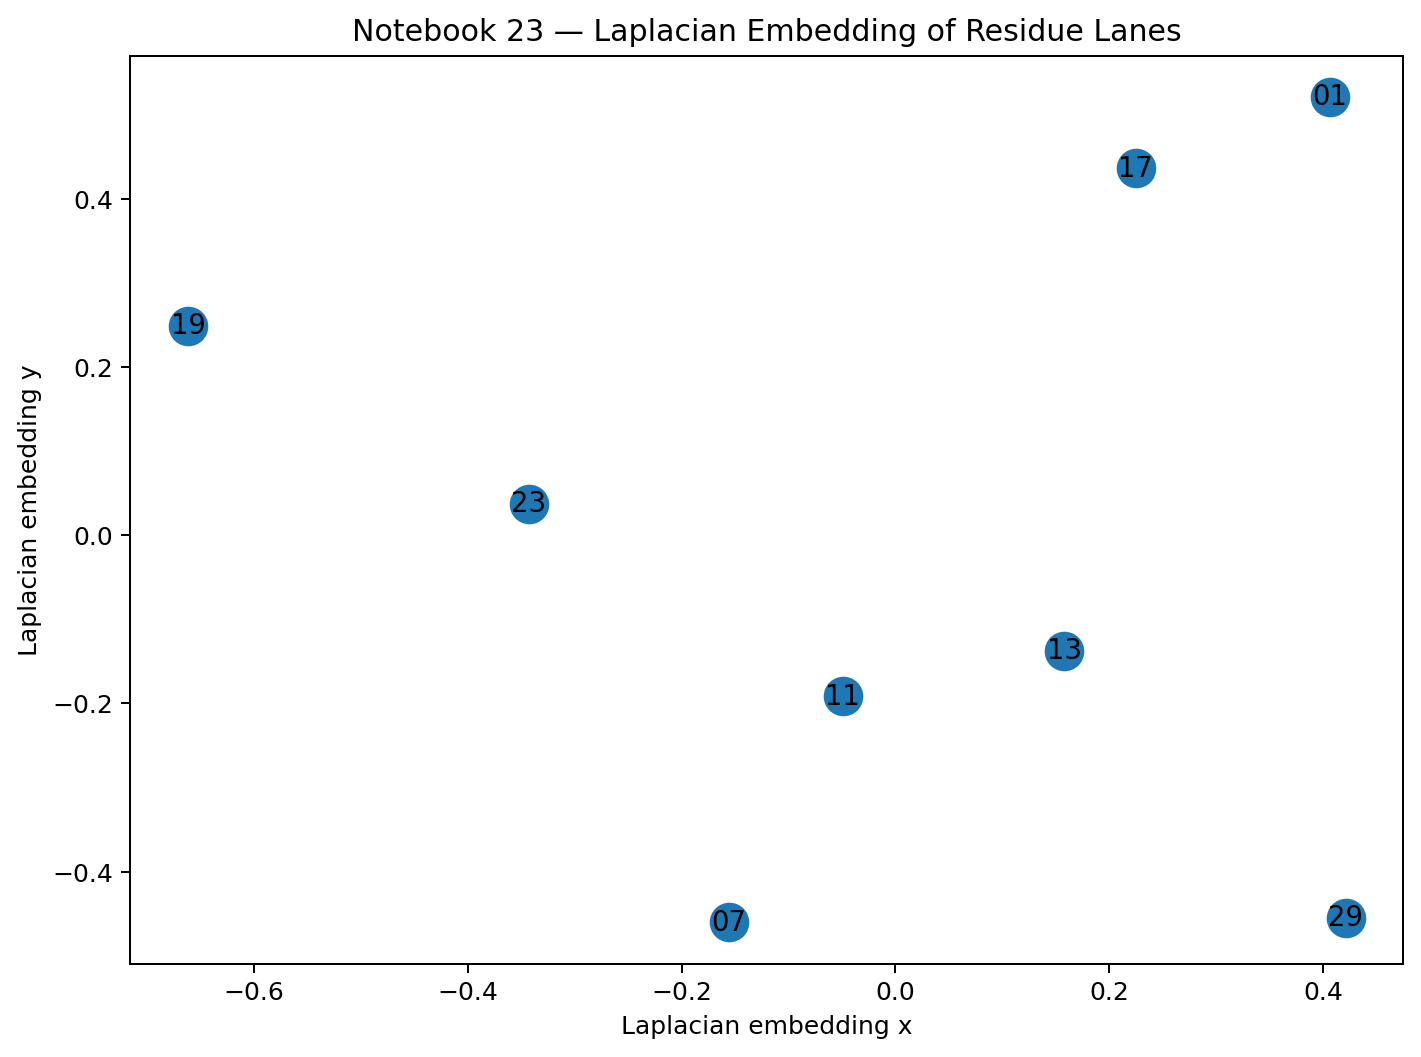
laplacian_embedding |
Two-dimensional graph embedding from Laplacian eigenvectors. |
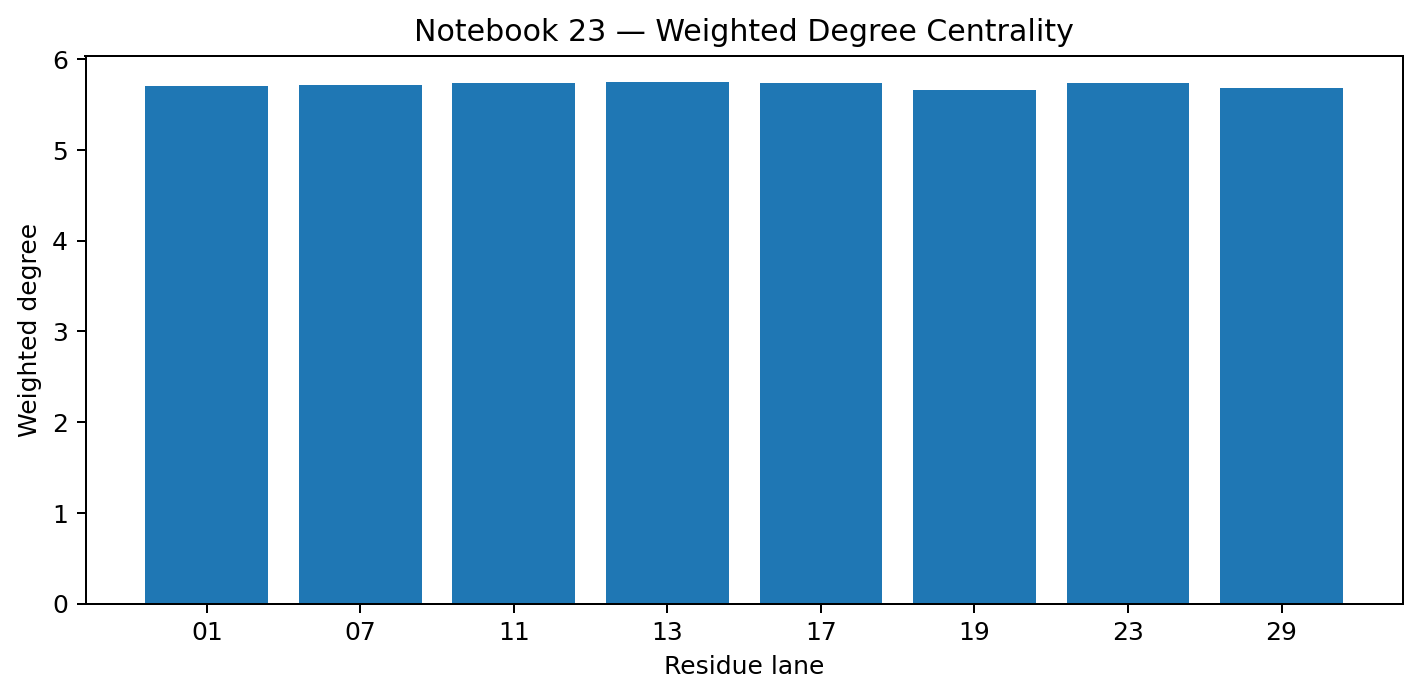
node_centrality |
Weighted degree of each residue lane inside the learned graph. |
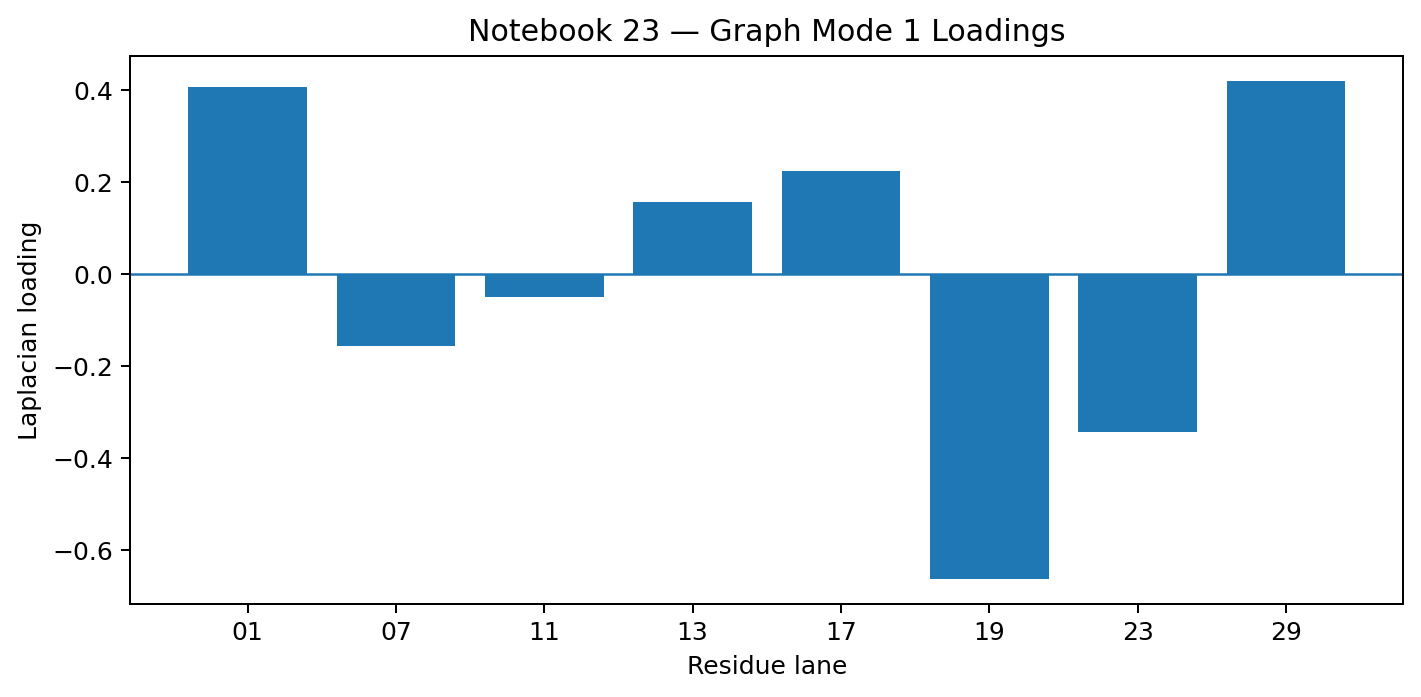
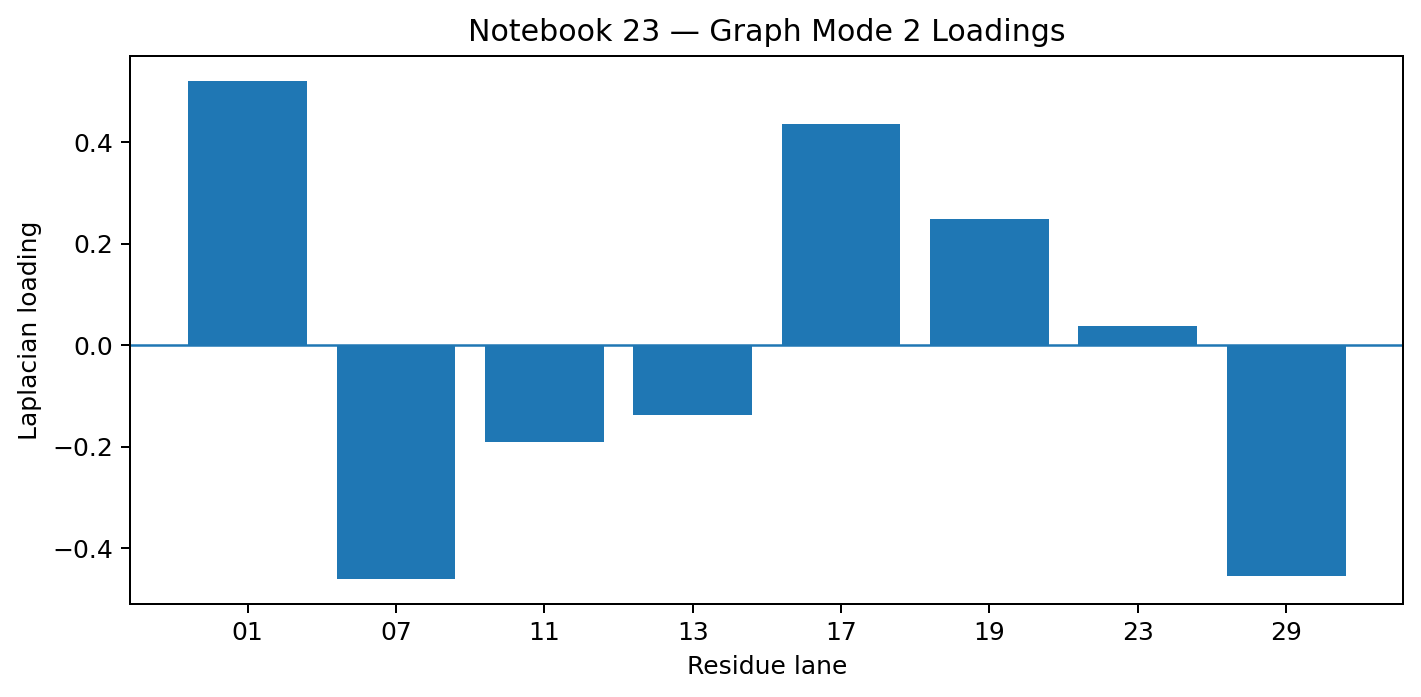
graph_modes |
Laplacian eigenmodes that describe graph-level lane structure. |
graph_signal_scores |
Temporal projections of rolling lane vectors onto graph modes. |
Lane Similarity Graph
Laplacian Embedding
Graph Adjacency Matrix
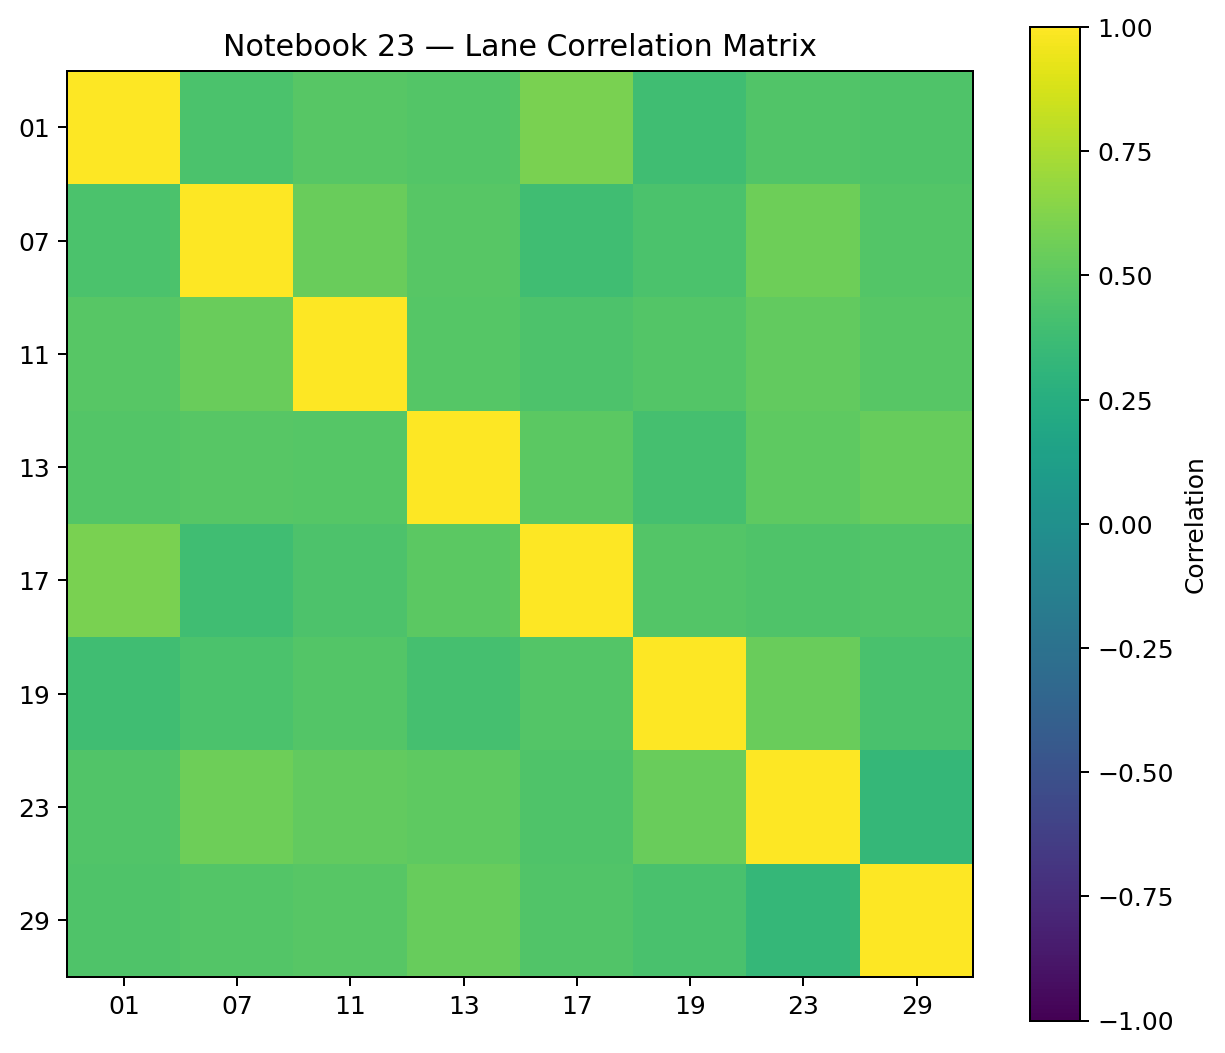
Lane Correlation Matrix
Weighted Degree Centrality
Sorted Edge Weights
Graph Mode 1 Loadings
Graph Mode 2 Loadings
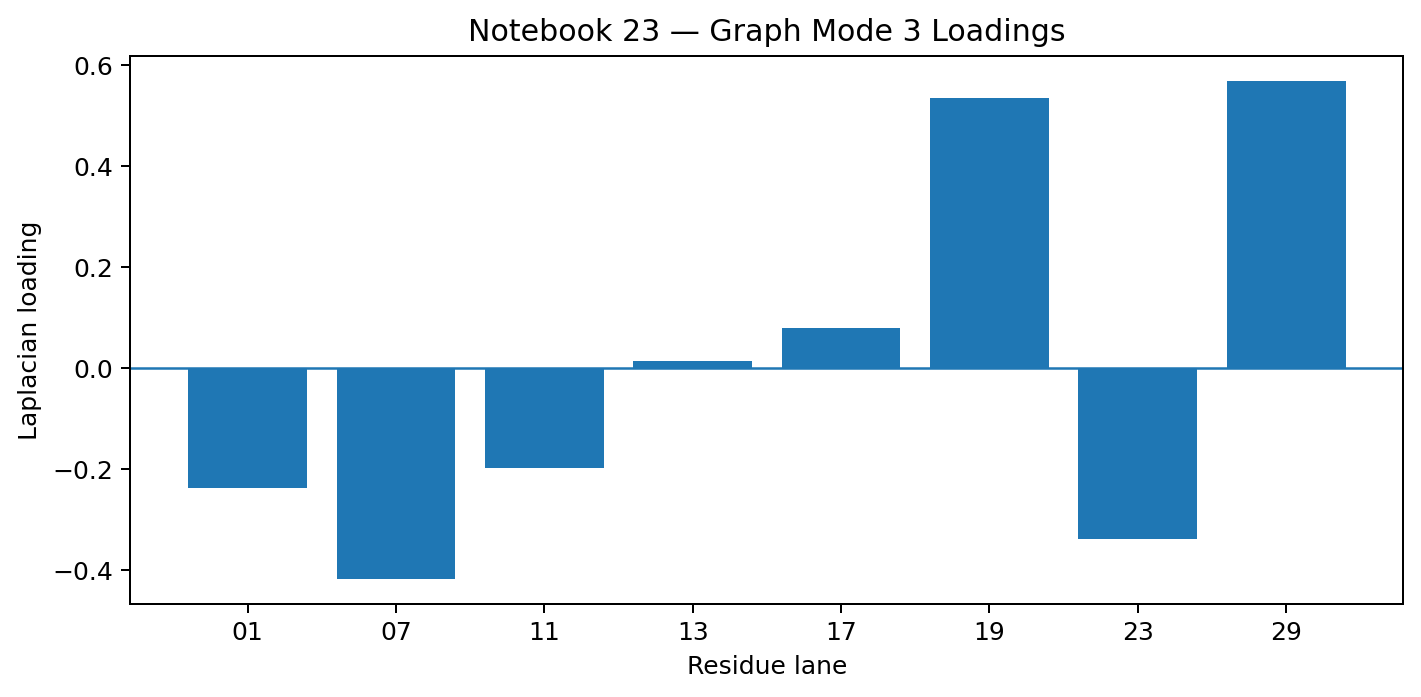
Graph Mode 3 Loadings
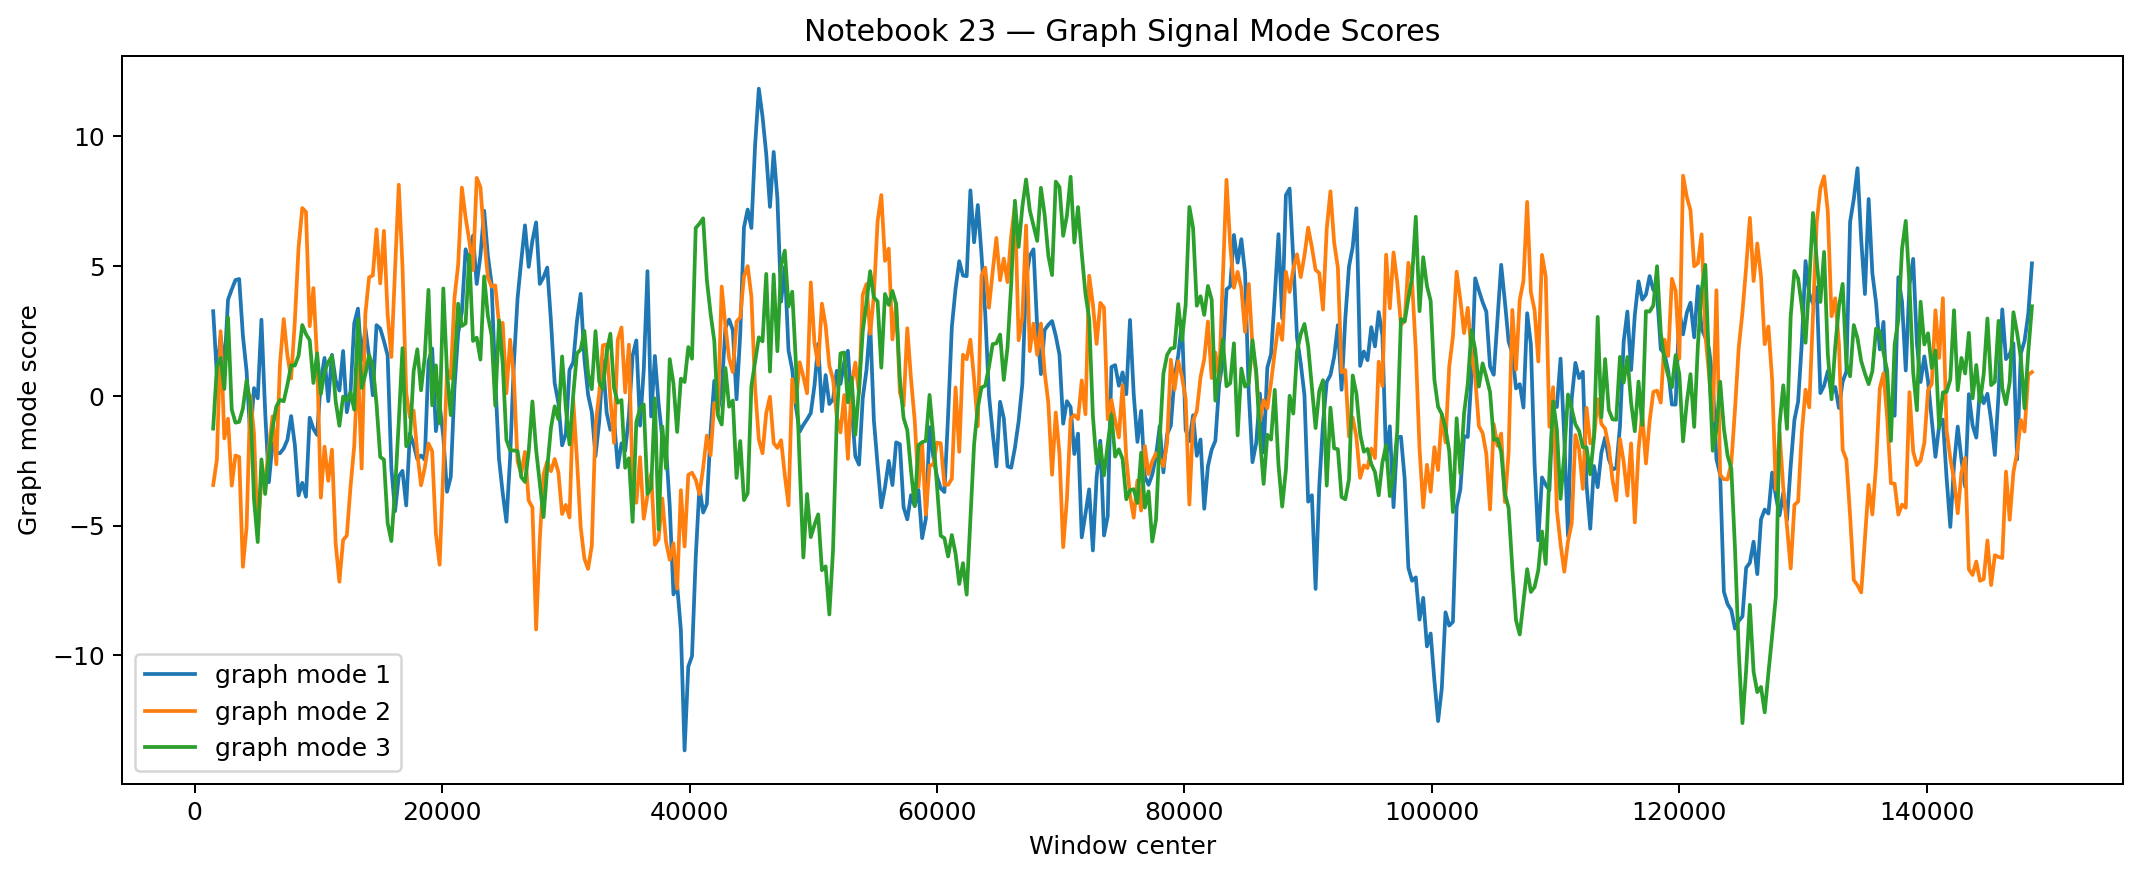
Graph Signal Mode Scores
Interpretation
Notebook 23 shows that residue lanes can be treated as graph nodes whose weighted edges emerge from rolling prime-lane trajectories.
The graph is not imposed as a fixed wheel. It is learned from:
- trajectory similarity,
- cosine alignment,
- covariance structure,
- and graph Laplacian geometry.
This report makes the residue manifold explicitly topological: lane relationships become a graph that can support centrality, community structure, Laplacian modes, and graph-signal dynamics.
Relationship to Neighboring Notebooks
Notebook 19 studied temporal spectral dynamics and phase continuity.
Notebook 23 converts those lane relationships into graph geometry.
Notebook 29 then uses this manifold framing to study sparse reset-boundary emergence
along the transition path 23 → 29 → 01.