mod30-residue-lanes / lab report
Notebook 17 — Reflected Manifold Decomposition
Boundary pressure becomes spectral structure through reflected manifold modes:
13 | 17 → reflected modes → low-rank manifold structure
Overview
Notebook 17 turns boundary pressure into spectral structure.
Notebook 13 measured pressure around the central split between lane 13 and lane 17. Notebook 17 anchors the reflected side of that split and decomposes rolling residue-lane trajectories into shared modes, reflected modes, and local deviations.
boundary pressure → covariance structure → spectral modes
The result is a low-rank view of the residue manifold: most of the rolling dynamics can be understood through a small number of coordinated eigenmodes.
Core Features
| Feature | Description |
|---|---|
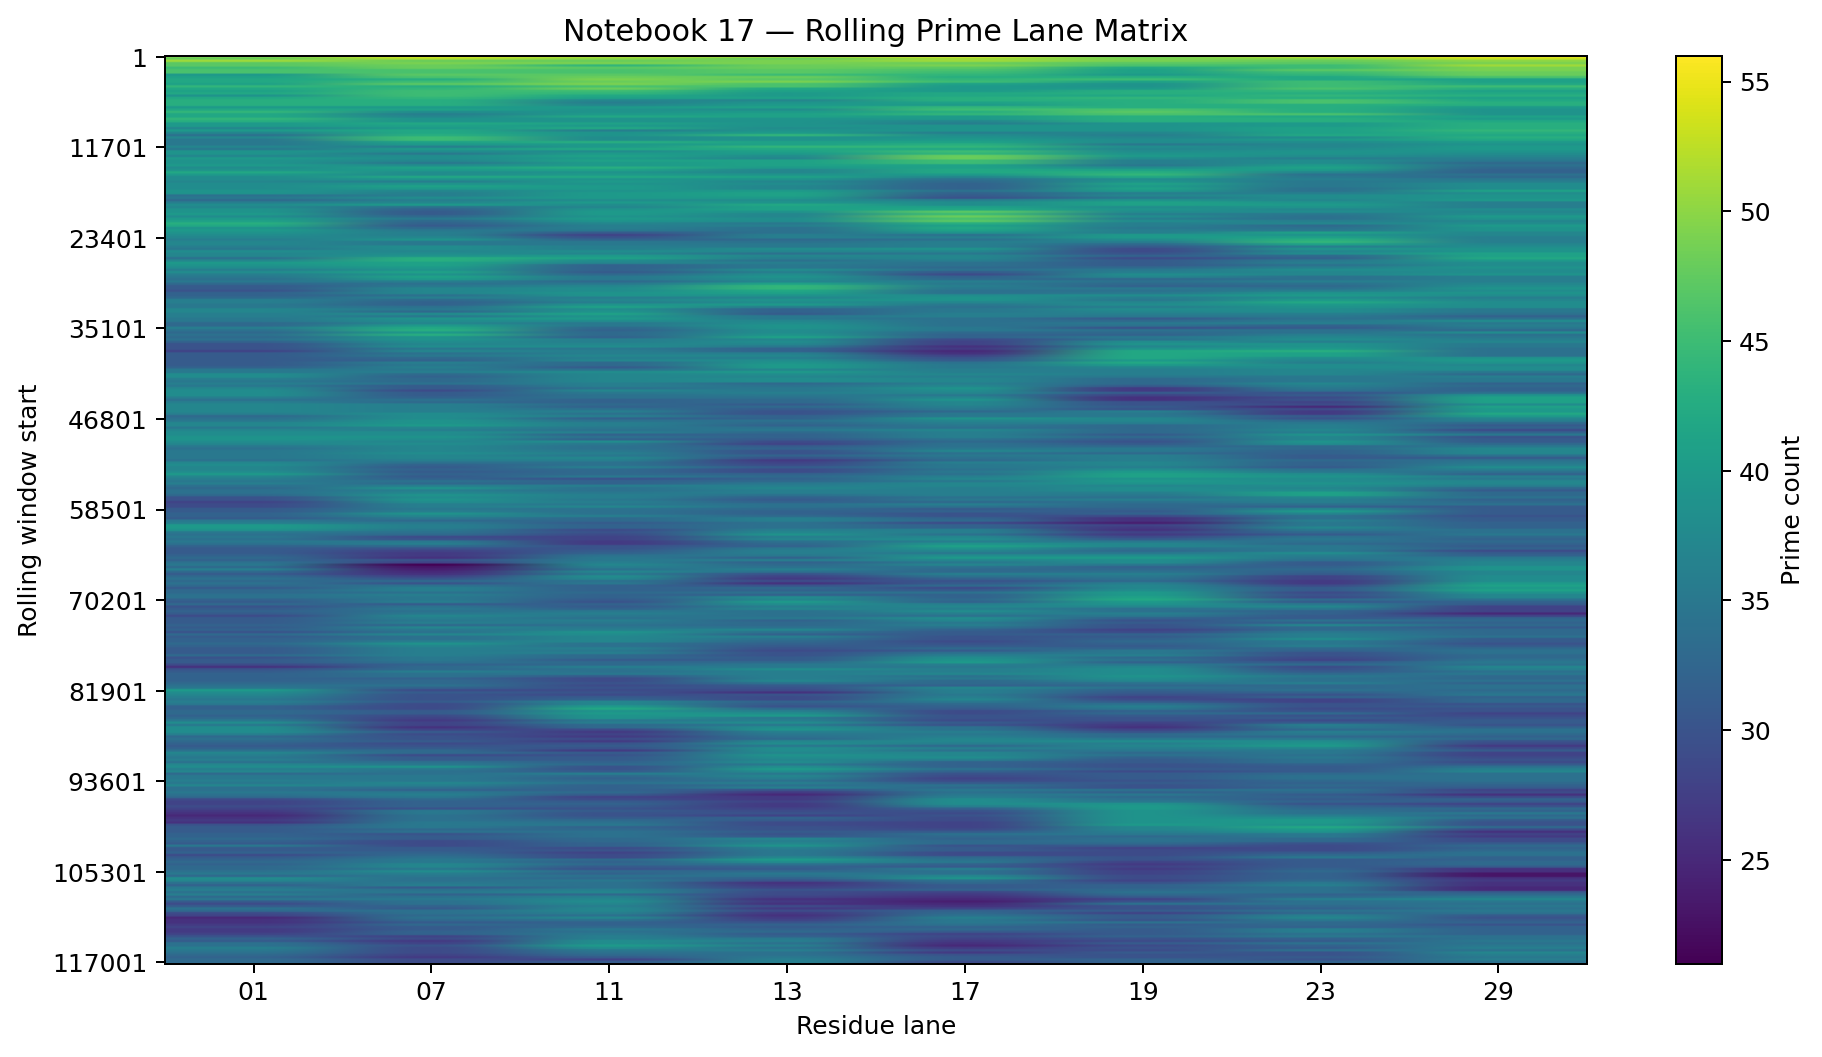
rolling_prime_lane_matrix |
Window-by-lane matrix of rolling prime-count trajectories. |
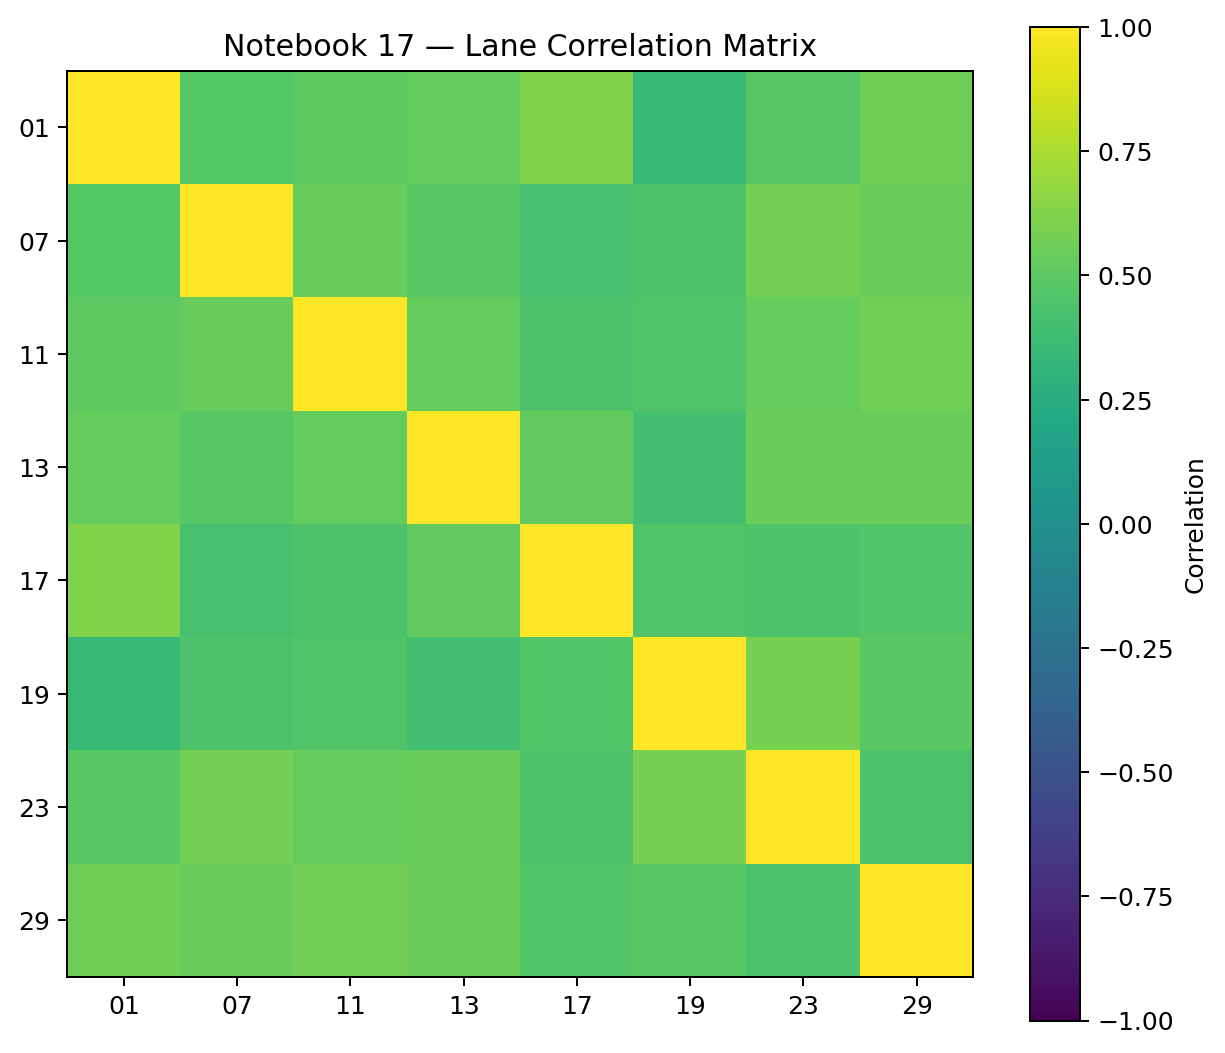
lane_correlation_matrix |
Pairwise correlations between residue-lane trajectories. |
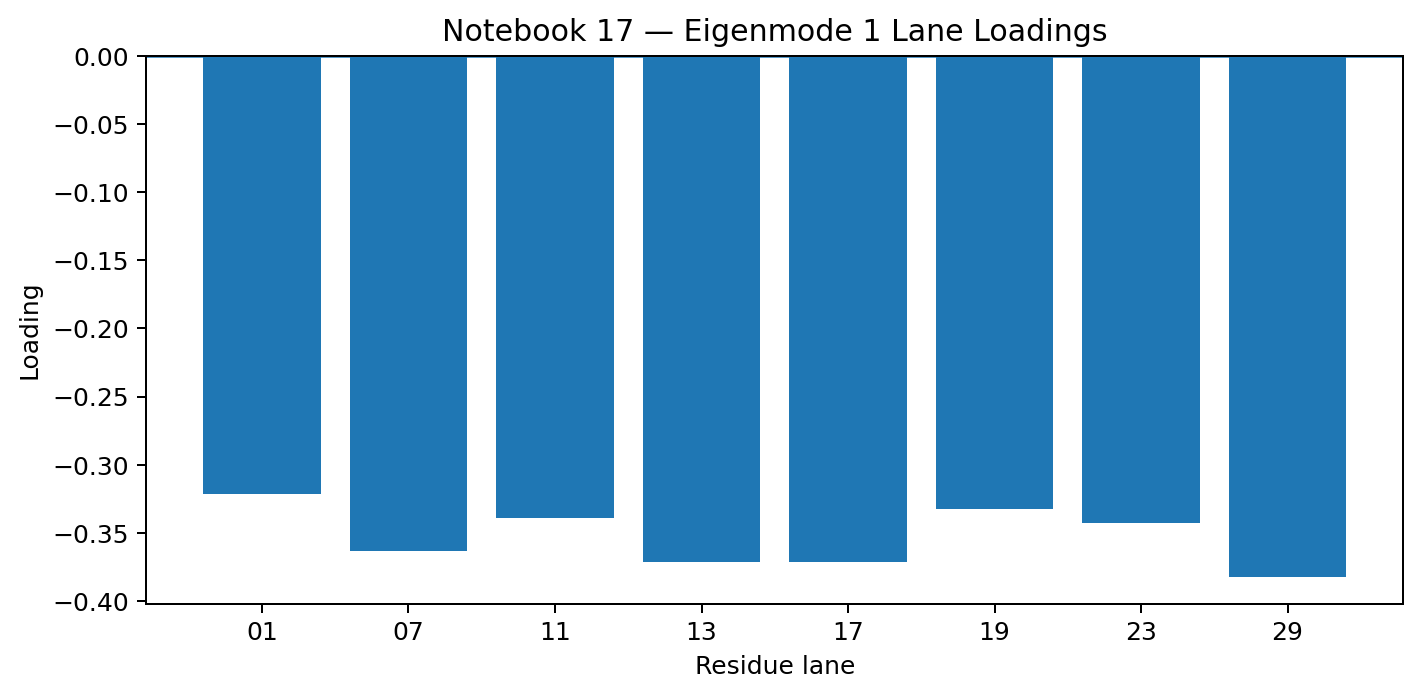
spectral_modes |
Eigenvectors of the covariance matrix, interpreted as coordinated lane modes. |
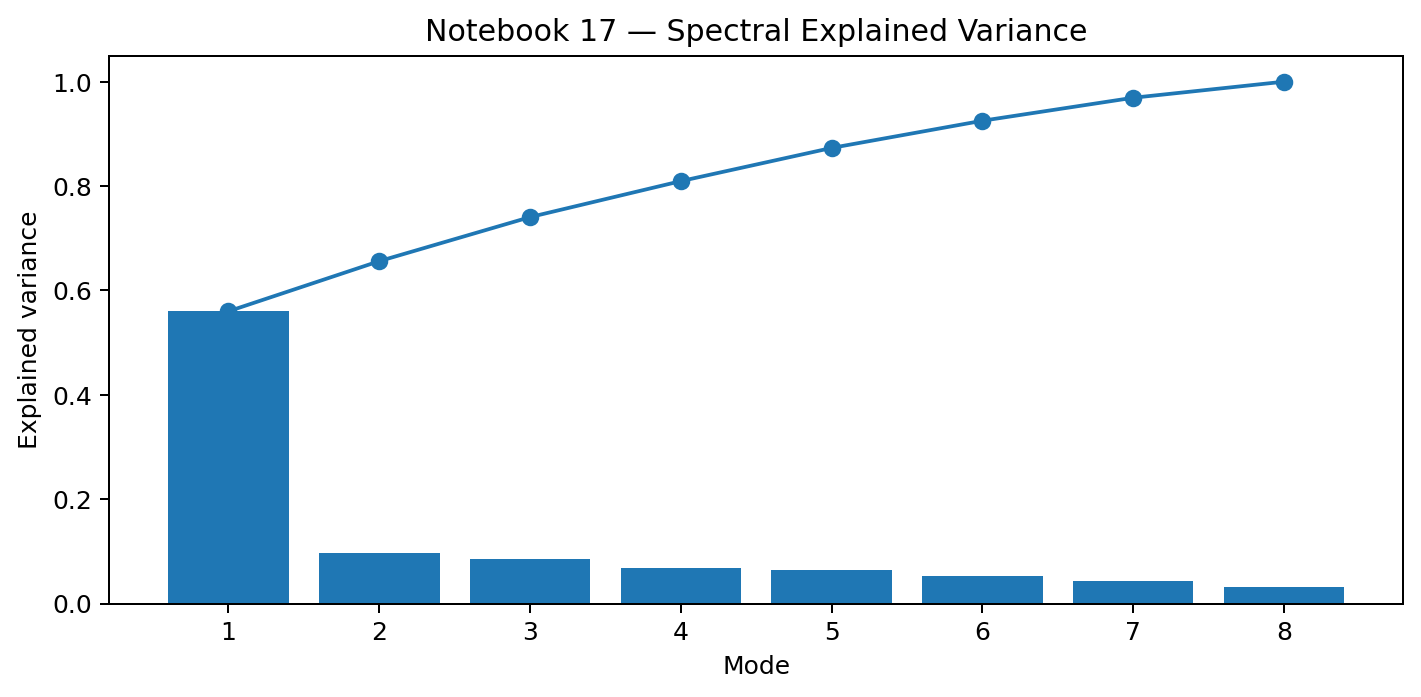
explained_variance |
Variance captured by each spectral mode. |
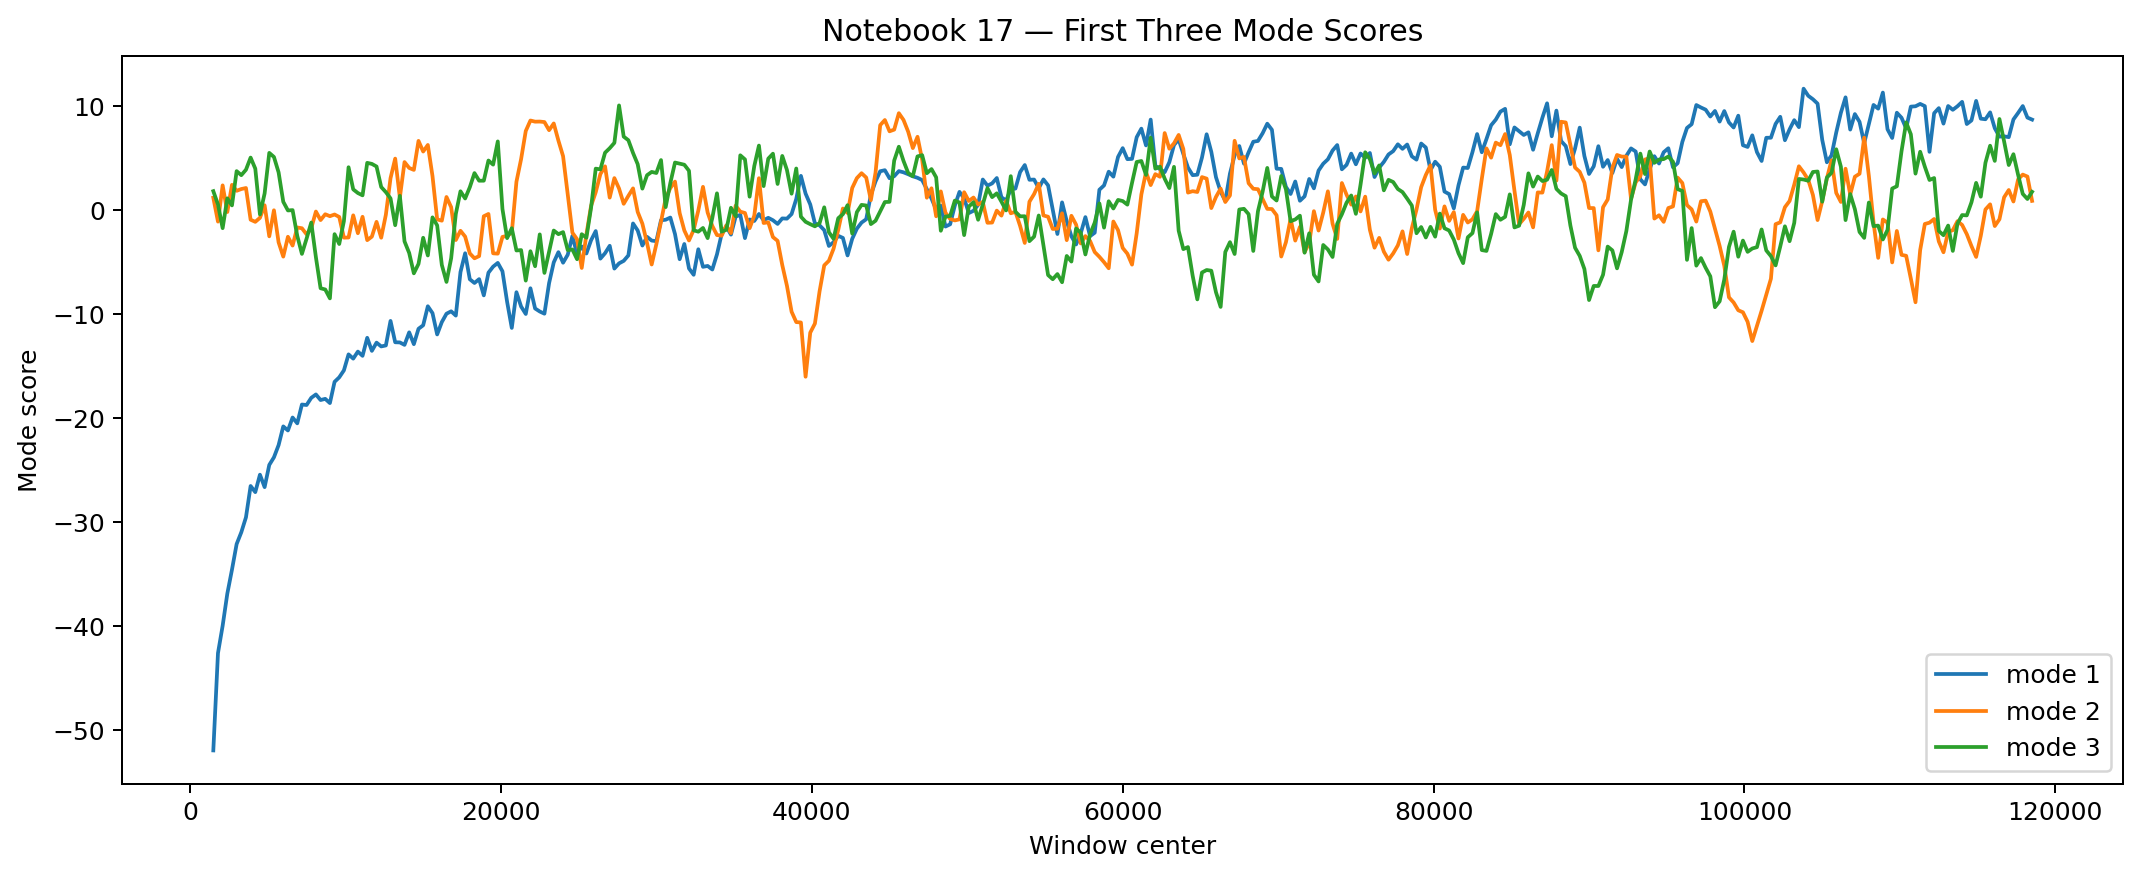
mode_scores |
Temporal activation of each mode across rolling windows. |
low_rank_reconstruction |
Reconstruction error after retaining only the leading modes. |
Rolling Prime Lane Matrix
Lane Correlation Matrix
Spectral Explained Variance
Eigenmode 1 — Shared Background Mode
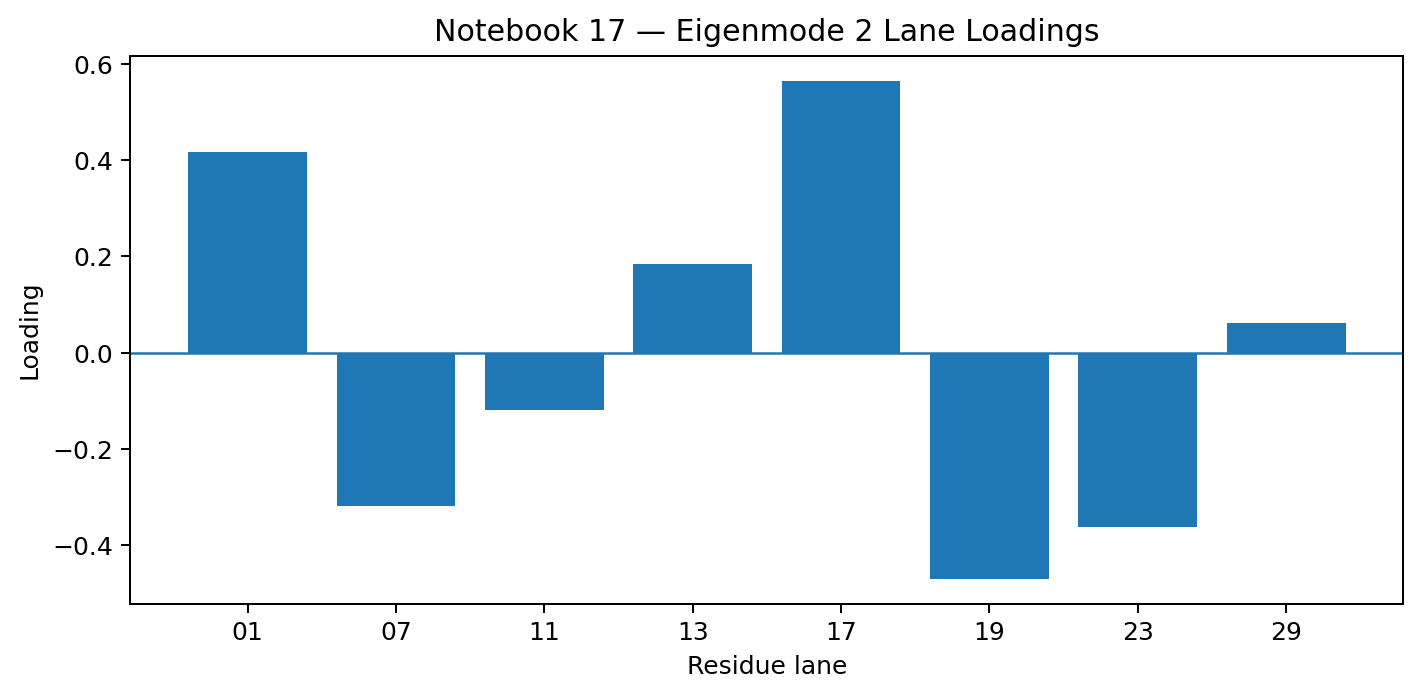
Eigenmode 2 — Reflected Lane Partition
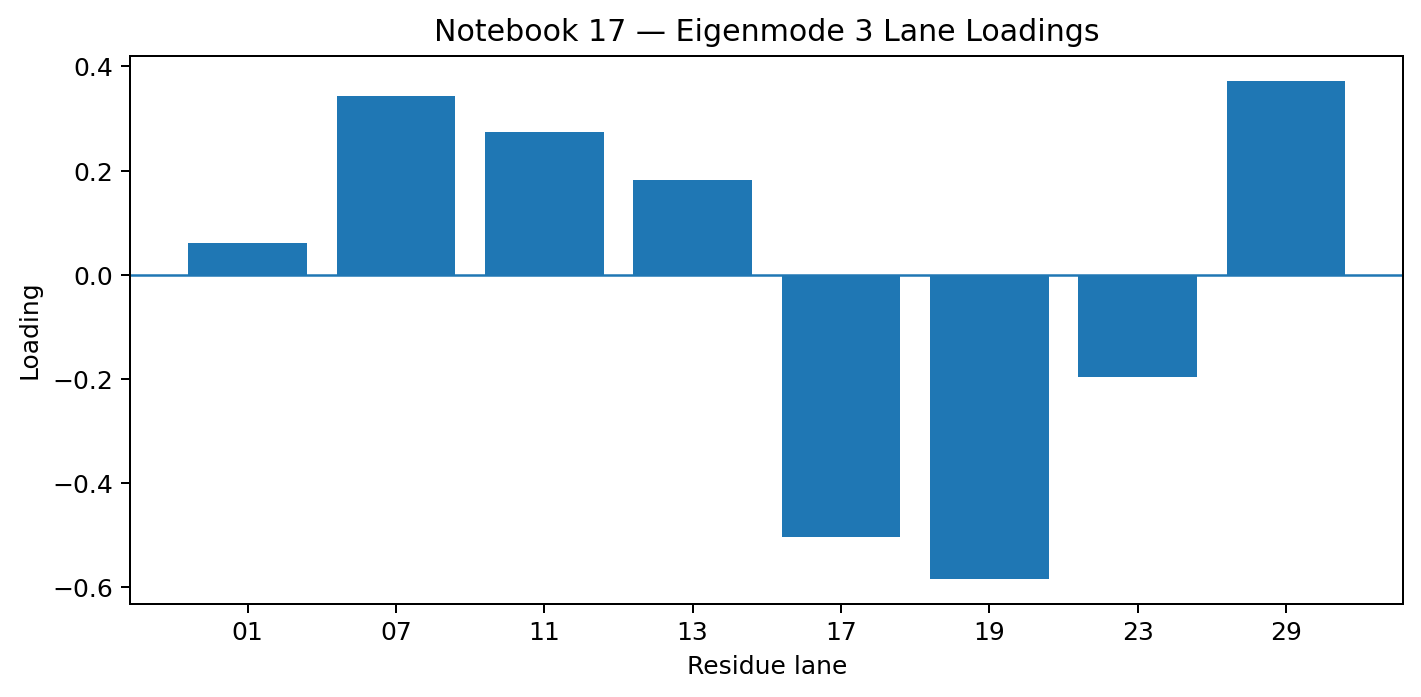
Eigenmode 3 — Local Deviation Structure
Mode Scores
Low-Rank Reconstruction Error
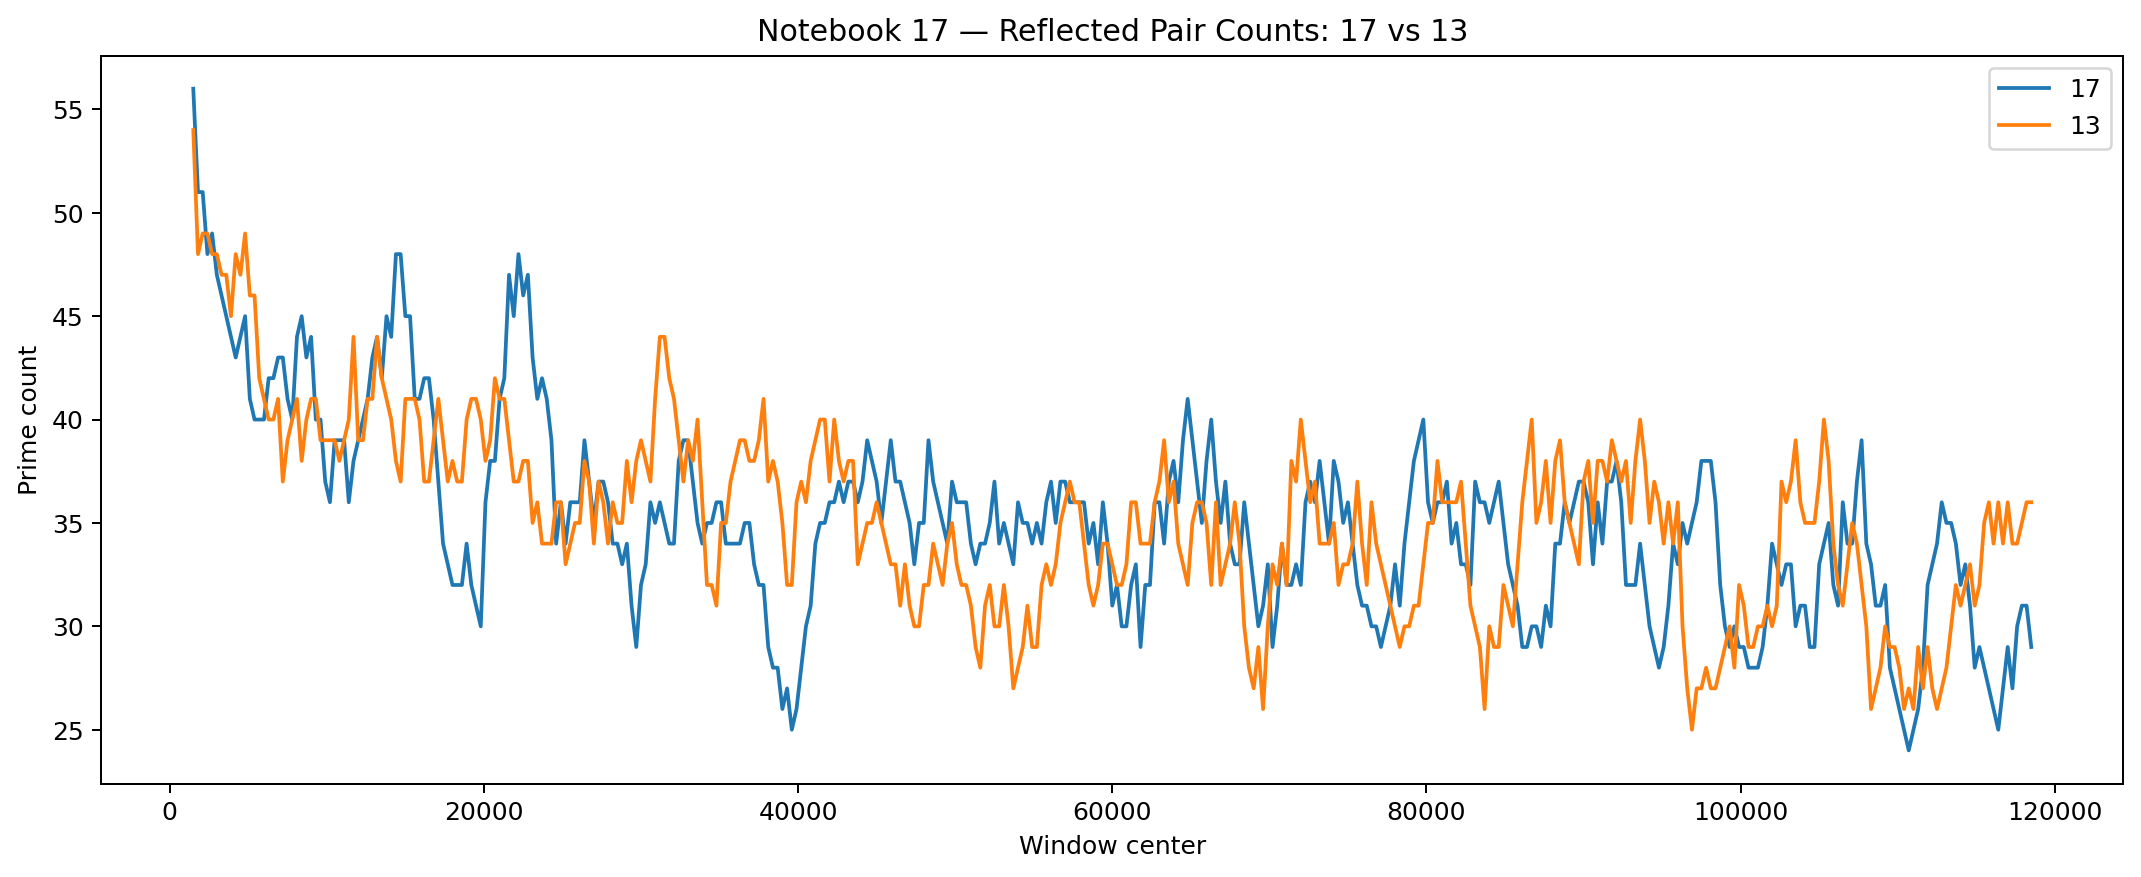
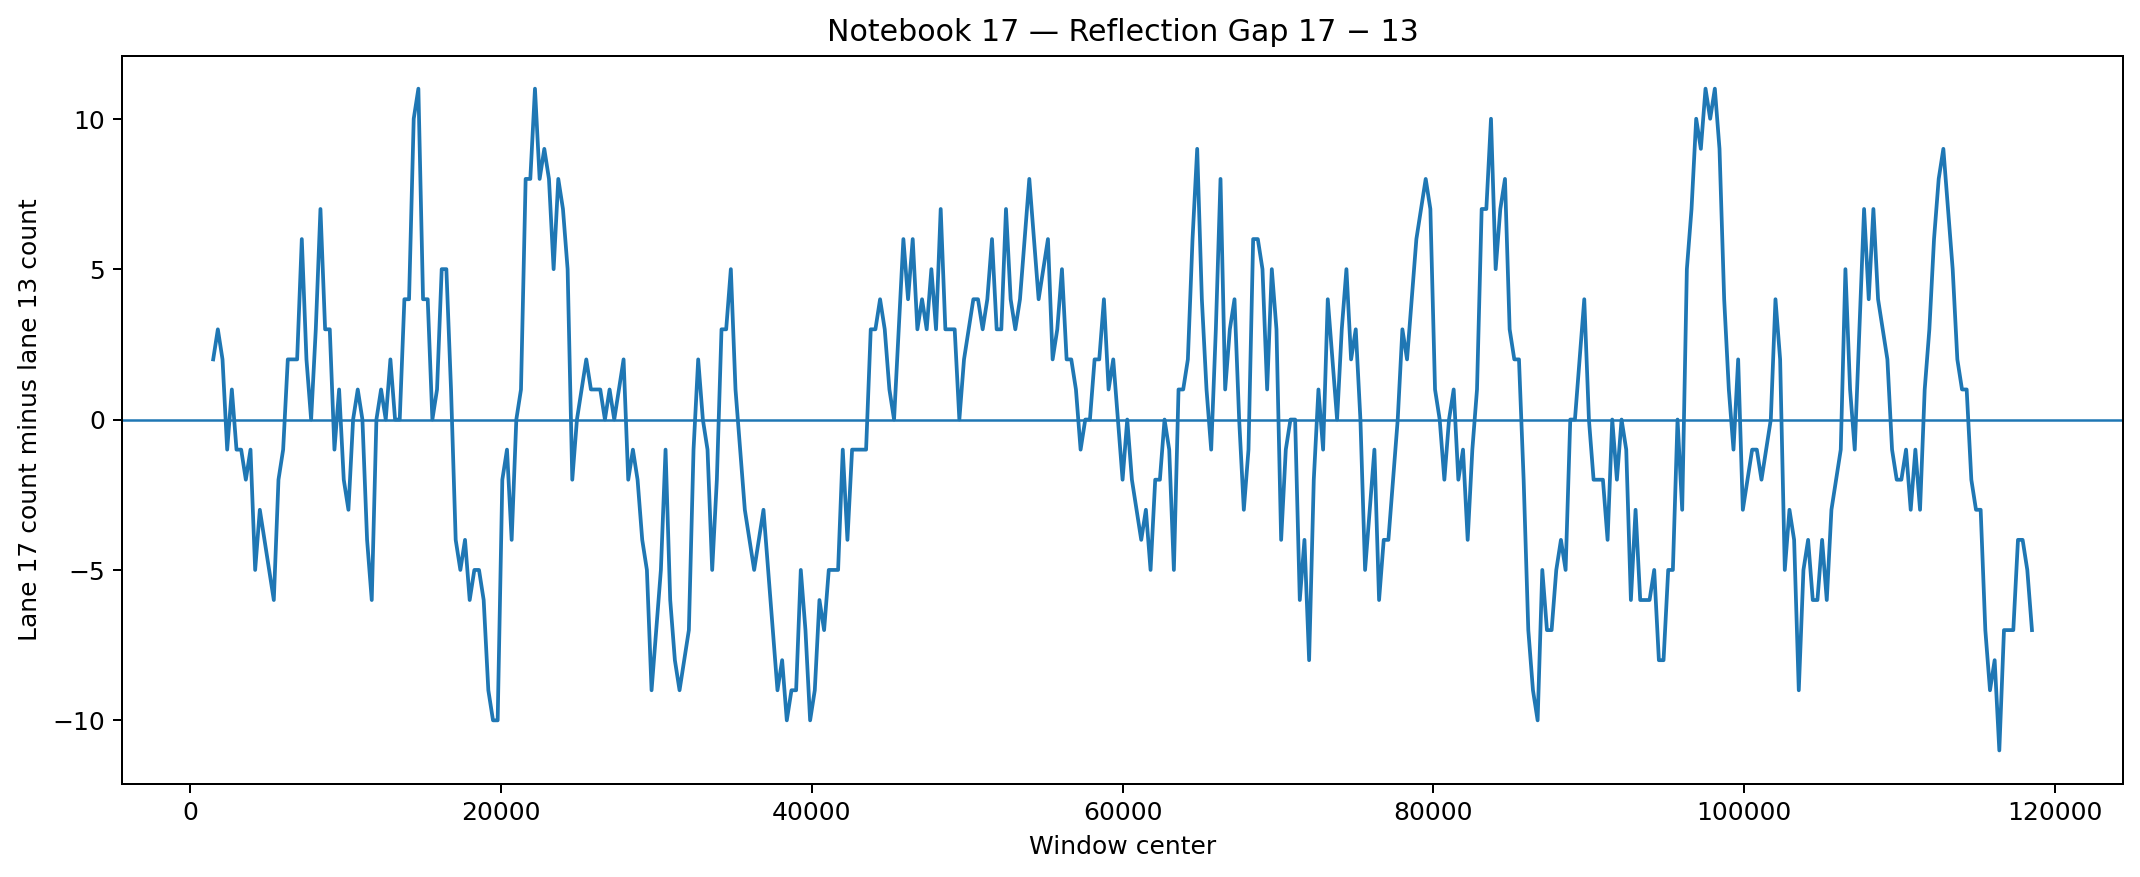
Reflected Pair Counts: 17 vs 13
Reflection Gap 17 − 13
Interpretation
Notebook 17 shows that rolling residue-lane dynamics are not just noisy fluctuations.
They decompose into:
- shared background modes,
- reflected lane partitions,
- local deviation structures,
- and low-rank manifold behavior.
This is the first report where the mod30 residue manifold becomes explicitly spectral.
Relationship to Neighboring Notebooks
Notebook 13 measured boundary pressure around the 13 | 17 split.
Notebook 17 turns that reflected boundary into covariance structure and spectral modes.
Notebook 19 then studies how those spectral structures evolve through time using rolling eigenspace stability, spectral entropy, and phase dynamics.